Chart Line
Advertisement

Swiftchart: chart, graph java applet
Chart java applet software to generate dynamic charts and graphs - bar, line, pie, stacked and grouped charts in 2D and 3D with a wide range of parameters and chart types. Main features: Charts in 2D/3D, Anti aliasing, Multi language support, Cross
Advertisement

Swiftchart: chart and graph java application v1_60 v.1.0
Chart java applet software to generate dynamic charts and graphs within JSP, servlets or java applications - bar, line, pie, stacked and grouped charts in 2D and 3D with a wide range of parameters and chart types. Main features: Charts in 2D/3D,
Swiftchart: chart, graph java applet v2_20 v.1.0
Chart java applet software to generate dynamic charts and graphs - bar, line, pie, stacked and grouped charts in 2D and 3D with a wide range of parameters and chart types. Main features: Charts in 2D/3D, Anti aliasing, Multi language support, Cross
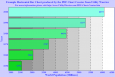
Transmission Line Details v.1.1
Experiment with transmission lines. Watch impedance points change on a Smith chart as you quickly vary input parameters using spin buttons. Plot matched line loss versus frequency.
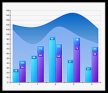
Animated Chart Pro - Flash Chart Software
Animated Chart creates dynamic flash charts to publish them to web sites. All items and structures of flash charts are customizable with clicking the chart preview. Select a flash chart type: Area, Bar, Bubble, Column, Doughnut, Line, Pie, Scatter, Radar,
NextwaveSoft WPF Suite Chart and Gauge
Nextwave Software WPF Suite with WPF Chart and Gauge is a component suite that helps you to visualize your data in Windows Presentation Foundation applications. The suite contains more than 40 2D/3D charts, such as area, bar, column, line, pie, doughnut,
3D Multi Series Line Graph v.2 1
This applet is designed to take multiple series of numerical data and display the information as a 3D Multi series Line Graph. The applet will automatically size itself to the available area given to it by the HTML form.

2D/3D Line Graph Software v.4 6
The 2D / 3D Line Graph provides both a client and server side solution for the incorporation of line graphs and charts into web pages.
Manco.Chart for WPF v.5. 3. 2001
Manco.Chart for WPF is the perfect solution to add the most advanced, feature rich charts to Windows Presentation Foundation applications. Over 40 major 2D/3D charts are available, such as traditional area, bar, column, line and pie charts,
Chart Fu v.1.0.3679.42056
Chart Fu is an easy to use desktop app that you can use to annotate any stock chart. An easy to use desktop app that you can use to annotate any stock chart. Chart Fu is ideal for keeping a technical analysis journal, sharing your charts on forums,
Nevron Chart for .NET v.2016.1
Nevron Chart for .NET is a professional charting component for .NET, featuring numerous business, scientific and financial charting types, gauges, VS design time support, AJAX support, built-in toolbar, flexible axes, and much more.